NYC in a nutshell: the 311

You probably know the 9-1-1, the US emergency number. But you may not be as familiar with 3-1-1. As multiple US and Canadian cities , New York City implemented this non-emergency requests number . By calling this number (or by visiting the online portal), you can make requests of inform the city of very various problems: rats sighting, broken water heater in a city building, broken street lamp, noise in the street, illegal parking,...
Note that in 2019 only calls until November are included


How it came to be and where it is heading
The service was first launched in Baltimore in 2001. Thanks to the success and rapid growth, it served as a model to be replicated in other cities. Only two years later it was established in NYC. It is known that it is the city that never sleeps and same holds for the NYC311 which operates 24/7. Since 2010 the calls are published on the data.cityofnewyork.us website , updated daily. Not surprisingly, its popularity is on the increase as more and more citizens are conscious of it and decide not to ignore the problems they spot.

NYC Wordcloud

Neighborhood Tabulation Areas (NTA)

There exist several ways to split a city in meaningful ways. Blocks, districts, boroughs,... But in New York City, it's interesting to consider Neighborhood Tabulation Areas (formerly "Neighborhood Projection Areas"), or simply NTAs.

According to NYC official website: [NTAs] were created to project populations at a small area level, from 2000 to 2030 for PlaNYC, the long-term sustainability plan for New York City. Since population size affects the error associated with population projections, these geographic units needed to have a minimum population, which we determined to be 15,000. This criterion resulted in combinations of neighborhoods that probably would not occur if one were solely designating boundaries of historical neighborhoods.
It becomes interesting to compare NTAs between them with an innovative criterion: the number of requests made concerning each of them. With that, and because they have a relatively similar count of inhabitants, we are able to "rank" them according to certain criterions. With that, we could help recommend arriving citizens some favorable places according to their preferences: if noise is a real problem for them, we would recommend them not to settle in a place with many requests linked to noise. We have access to the population data of the NTAs (2010 census), which will allow us to construct a better ranking scheme that normalizes the number of complaints by the population size of the NTA.

Analysis

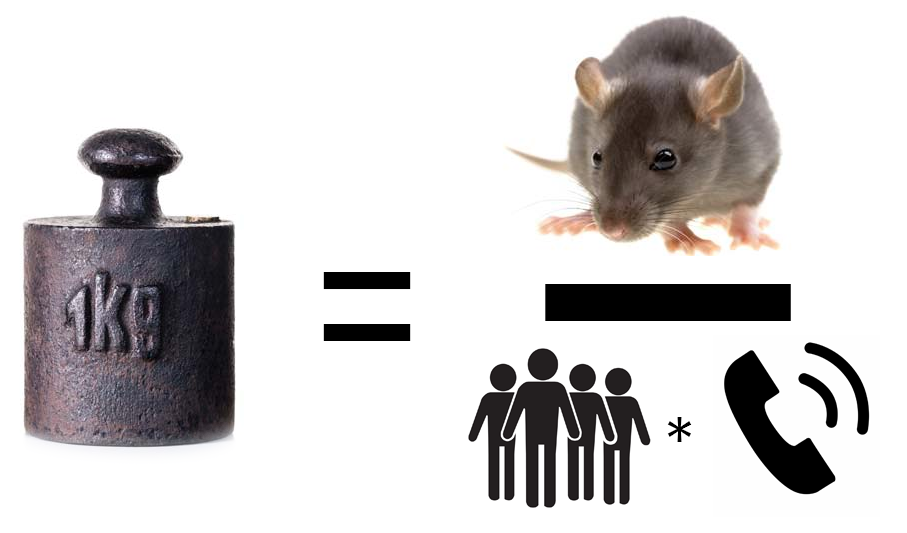
A naive ranking would only look at the number of complaints per NTA. Since we have access to population sizes, a more sensible ranking scheme takes into account the population size of an NTA.
One NTA really stands out, both in terms of total complaints and complaints per capita: Rikers Island. This example highlights the fact that no ranking is perfect and should therefore be taken with a grain of 
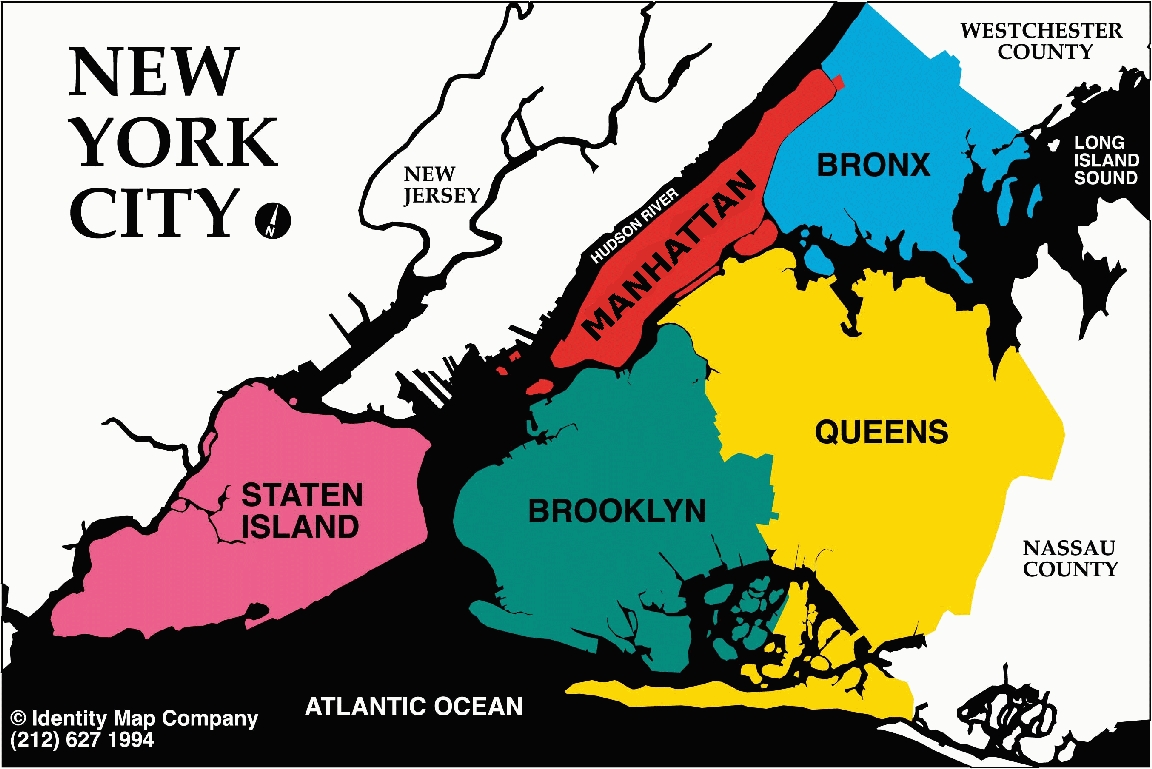
salt, we would not recommend moving to that island as it is a 1.67 km2 island in the East River between Queens and the Bronx that is home to New York City's main jail complex.
Interesting fact about Stuyvesant Town-Cooper Village and Starrett City: both NTAs have their own public safety forces, which might explain why they have so few complaints per capita. In fact, Starrett City had one of the city's lowest crime rates, mainly because of the existence of the security force. This private security force has been used as a case study in the advantages of private security over public policing.

Finally, while a general rankinkg that looks at all types of complaints certainly is helpful, people have different preferences when it comes to choosing a place to live. For instance one might not care about the fact that there are frequently problems with the infractructure of a neighborhood (brooken streetlight, graffitis on the walls, but be very sensitive to noise. This is why we now take a closer look at a selection of NTAs, that already have the lowest number of complaints per capita, but distinguish between different Complaint Categegory Classes (CTCs), to see how the NTAs perform in each category, with respect to the city-wide average.

Departments

While NTAs are geographical separation of the city, we can also split a city according to the nature of the problem. Obviously, illegal parking, street light condition and broken water heater should not go to the same people. This is the role of Departments. There are officially about 45 agencies/departments registered, but 3-1-1 requests go to only a handful of them:
  • HPD (Housing Preservation & Development)
  • NYPD (New York Police Department)
  • DOT (Department of Transportation)
  • DSNY (Department of Sanitation of New York)
  • DEPP (Department of Environmental Protection Police)
It is interesting to look at the distribution of requests among them.
Much of the calls are directed to the famous NYPD (New York Police Department). Let’s zoom out from the granularity of the NTAs and look at the big picture - the boroughs.
NYC boroughs
311 is a non emergency line, so we don’t expect to see crimes reported. In fact the most common problems tackled by NYPD through 311 are:
  • Noise complaints
  • Illegal parking
  • Dealing with derelict vehicles
  • Animal abuse
Staten Island has the reputation of being the safest borough in the Big Apple. It also appears to be the most calm, with the smallest proportion of its 311 calls directed to NYPD.
On the other end of the spectrum we see Queens, where most common problem is a blocked driveway. This type of complaint is, next to illegal parking and noise among top 3 annoyances in all the boroughs but Manhattan. In Manhattan it is noise of all types that occupies the minds of inhabitants. Interestingly it is the only borough where the issue of homeless encampments makes it to the top 10.

Seasonality

Since the dawn of humanity, humans have lived their lives in accordance to seasons. Behaviors drastically change between winter and summer. In summer, people tend to go away for vacations, and in winter tend to stay at home instead of going out. Meanwhile, spring sees a lot of people in the street, as the weather is warmer but you're not in vacations yet.

This is equally true for natural events: coincidentally, people tend to need snow plowing more often in winter than in summer (who knows why ?). This is the goal of this section: perform an analysis on the seasonality of different events.

If we are able to uncover hidden recurrent events, we may be able to prepare for those events better, either by raising awareness in the population, or by better anticipating. This could lead to less stressful moments for city employees.
Below, you'll find an interactive graph, showing the count of request per month, split according to the "Complaint Type". Note that we only kept the 100 most frequent.
Howto: you can click on the legend items to enable/disable items one at a time. If you wish to enable/disable all at once, double click on an item. Use the tools at the top of the chart to move, zoom, etc.

Analysis

To save you the trouble, we picked a few interesting analysis. You can see for yourself by selecting the stated entries.
  • By selecting all forms of Noise, you'll notice peaks during summer. But interestingly, there used to be 2 peaks, back in 2010: one in May, one un Septembre (with a light pit between them). This shape slightly shifted in the recent years, to peak in June/September.
  • Sewers are not always fun, but we can learn from them. In particular, when they should be cleaned. By selecting the corresponding entry, we see a few small peaks, without real seasonality. But a huge peak appears in August 2011! Interesting! We believe the cause for this many calls is an earthquake that happened in late August 2011. The calls mostly happened after this date. It's an interesting lesson: after an earthquake, the city should also prepare additional people for cleaning the sewers.
  • Rodents are also not to be forgotten! They are sighted all year long, but summer marks their favorite time. More on this in the next section...
  • Although Trees are supposed to thrive during summer, this is also the period in which there are most requests about dead or dying trees. The cause may be that a dead tree is not necessarily spotted in winter, but in the heart of summer, not only is it very clear, but also they disturb passerby more.
    Note that the naming convention changed in 2016, reason why there are 2 entries.

Zoom: Pest in NYC

Rat with Pizza

Can you spot the NYC stereotypes in the picture above? Image taken from "New York City rat taking pizza home on the subway (Pizza Rat)"
The Rat Problem in NYC is so famous that it is honored by its dedicated Wikipedia article. An official channel for pest spotting in NYC is the 3-1-1 report system.

Thus, our dataset offers us the opportunity to take a look into the famous Rat Problem, principal component of pest reports aggregated under the complaint type class "pest".

We describe the steps to create a normalized timelapse heatmap/by NTA of pest report calls from 2010 to 2019 in the city.

We ultimately want to represent the intensity of pest problems by NTA using a weight computed from the amount of 311 calls. We note:

  • NTAs have different populations and we can assume population is somewhat proportional to reports count
  • 311 entries have been increasing over the decade
We will generate the weight by using the pest 311 entries, normalized per capita, normalized per total number of reports each year. We will restrict our source dataset to entries which contain valid information for date, NTA, for which NTAs contain population count, and which are defined as complaint type class pests.

You can find a visual representation the formula below:

Rat weight equation Image


You can find detailed information about seasonality description, normalization process, re-weighting of the NTAs in the notebook.

Below you can find the result of our computation, as a timelapse map over NYC:


As discussed in the notebook, the following conclusions can be made from the timelapse.
  • Clinton Hill, Prospect Heights, Stuyvesant and Bedford, at the center of Brooklyn, have fluctuating intensities over the years but consistently stay at the most pest-affected NTAs of the city.
  • During the early years of the decade, Staten Island is impacted more in the southern part. Over the decade, the southern part seems to be left alone by rats gradually, and inversly the nothern part slightly increases in weight. In general the pest intensity slightly subsides over the decade on Staten Island.
  • Southern Queens starts off as a hotspot for pest reporting. It gradually calms over the decade, but stays overall the most affected area in Queens.
  • In Central Harlem South, the problem is very intense throughout the decade. Melrose South-Mott Haven North, in the Bronx, witnesses a mostly constant increase in weight over the decade.
  • Southern Manhattan appears to gradually become more affected at the first half of the decade which then diminished after 2015.
Here are the areas comparatively unaffected by the problem:
  • Southern Brooklyn, especially south of Prospect park.
  • North-eastern Queens, east of Flushing-Meadows-Park but above the Grand Central parkway (south of the parkway, Jamaica, is affected).
  • South Staten Island since the improvements of the early part of the decade.

We also provide complementary NTA ranking for best and worse pest exposure in the notebook.

Conclusion

We hope you enjoyed our tour in the City of Dreams. We looked at it from the point of the audible New Yorkers - those who don’t hesitate to report the problems at sight via 3-1-1 service. We have seen what bugs them most and observed temporal patterns. Even within one city the issues vary from place to place and that’s what we’ve observed in the scale of boroughs and in finer granularity, NTAs. At last, we zoomed in to the problem of pests in the city and there we found out that it is not stationary - over years different, but nearby, neighbourhoods are haunted by rats. This information might serve the city agencies such as Department of Sanitation in allocating their resources.

Here is our team

Thumbnail Image

Heitmann Julien

Usually responds You son a gun, I'm in when asked if he wants to participate in a data analysis project.

Thumbnail Image

Szałata Artur

Keen on mining information from wild, insubordinate data. Most excited by applications in biology.

Thumbnail Image

Cloux Olivier

Self-proclaimed specialist in the art of dealing with things that need to be dealt with. I hate and love data, depending on my current mood.

Thumbnail Image

Landelle Louis

None of us individually is as smart as all of us combined. What do I know though, I might be the dumbest one here.